Difference between revisions of "Extra:citation visualizations"
KevinYager (talk | contribs) (Created page with "==Existing tools for visualizing and data-analytics of citation networks== * [VOSviewer http://www.vosviewer.com/]: Tool for constructing and visualizing bibliometric networks...") |
KevinYager (talk | contribs) (→Existing tools for visualizing and data-analytics of citation networks) |
||
| (11 intermediate revisions by the same user not shown) | |||
| Line 1: | Line 1: | ||
==Existing tools for visualizing and data-analytics of citation networks== | ==Existing tools for visualizing and data-analytics of citation networks== | ||
| − | * [ | + | * [http://www.vosviewer.com/ VOSviewer]: Tool for constructing and visualizing bibliometric networks. Offers text mining functionality that can be used to construct and visualize co-occurrence networks of important terms extracted from a body of scientific literature. |
* CiteSpace: Java application for visualizing and analyzing trends and patterns in scientific literature. | * CiteSpace: Java application for visualizing and analyzing trends and patterns in scientific literature. | ||
** [http://cluster.cis.drexel.edu/~cchen/citespace/ Official site.] | ** [http://cluster.cis.drexel.edu/~cchen/citespace/ Official site.] | ||
** [https://sites.google.com/site/citespace101/home Documentation.] | ** [https://sites.google.com/site/citespace101/home Documentation.] | ||
| + | ** Paper: "[https://www.cambridge.org/core/journals/mrs-bulletin/article/div-classtitleanalysis-of-citation-networks-as-a-new-tool-for-scientific-researchdiv/DA8BD29FD1AC549B56D61A44ABB6470E Analysis of citation networks as a new tool for scientific research]" ''MRS Bulletin'' '''2016'''. [https://doi.org/10.1557/mrs.2016.270 doi: 10.1557/mrs.2016.270] | ||
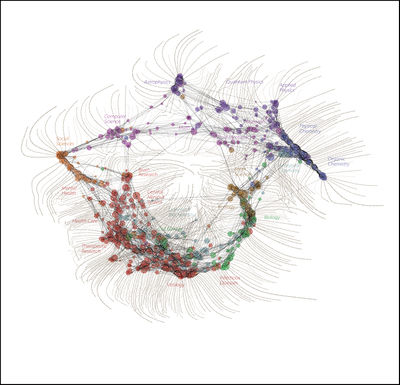
* [http://wbpaley.com/brad/mapOfScience/ Relationships among scientific paradigms]. Well-publicized "map of science", generated using bespoke software. (Was reprinted in Nature, Discovery Magazine, [http://seedmagazine.com/content/article/scientific_method_relationships_among_scientific_paradigms/ SEED], etc.) | * [http://wbpaley.com/brad/mapOfScience/ Relationships among scientific paradigms]. Well-publicized "map of science", generated using bespoke software. (Was reprinted in Nature, Discovery Magazine, [http://seedmagazine.com/content/article/scientific_method_relationships_among_scientific_paradigms/ SEED], etc.) | ||
| − | [[Image:Scimaplarge.jpg|thumb| | + | [[Image:Scimaplarge.jpg|thumb|400px|center]] |
| + | ==General Visualization Tools (that could be used for citation networks)== | ||
| + | * [http://python.org/ Python]: General-purpose high-level programming language. | ||
| + | ** [http://matplotlib.org/ matplotlib] for generalized plotting | ||
| + | ** [https://www.wakari.io/sharing/bundle/twneale/Citation%20Network%20Analysis iPython network citation example] | ||
| + | ** [http://networkx.github.io/ NetworkX]: Package for the creation, manipulation, and study of the structure, dynamics, and functions of complex networks. | ||
| + | ** [https://snap.stanford.edu/snappy/ Snap.py]: Python interface to SNAP, providing high-performance node/network layout and visualization. | ||
| + | * [https://d3js.org/ D3.js]: JavaScript libraries for visualization. Well-suited to interactive web-based analytic tools. | ||
| + | ** [https://github.com/d3/d3/wiki/Gallery Gallery] | ||
| + | * [https://plot.ly/feed/ plotly]: Data science collaboration platform. | ||
| + | ** [https://plot.ly/ipython-notebooks/network-graphs/ Network graphs] | ||
| + | ** [https://plot.ly/python/3d-network-graph/ 3D network graphs] | ||
| + | * [http://www.cytoscape.org/ Cytoscape]: Network analytics platform. | ||
| + | * [https://gephi.org/ gephi]: Network graphs. | ||
| + | * [https://sites.google.com/site/fusiontablestalks/ Google Fusion Tables] | ||
| + | ===Graphs=== | ||
| + | * [https://www.vistrails.org/index.php/Main_Page VisTrails]: Workflow software with different data-visualization plugins. | ||
| + | * [https://vis.occrp.org/ VIS]: Graph layouts. | ||
| + | ===Social networks=== | ||
| + | * [http://socnetv.sourceforge.net/ SocNetV] | ||
| − | == | + | ==Additional Information== |
| − | * [ | + | * Potentially useful Google searches: |
| − | + | ** [https://www.google.com/search?q=visualization+of+citation+network visualization of citation networks] | |
| + | ** [https://www.google.com/search?q=visualization+of+citation+network&tbm=isch visualization of citation networks] (Image Search) | ||
| + | ** [https://www.google.com/search?q=network+of+scientific+collaboration&tbm=isch network of scientific collaboration] (Image Search) | ||
| + | * [https://www.dataquest.io/blog/python-data-visualization-libraries/ Python data visualization: Comparing 7 tools] | ||
| + | * [http://www.kdnuggets.com/2015/06/top-30-social-network-analysis-visualization-tools.html Top 30 Social Network Analysis and Visualization Tools] | ||
Latest revision as of 15:08, 11 January 2017
Contents
Existing tools for visualizing and data-analytics of citation networks
- VOSviewer: Tool for constructing and visualizing bibliometric networks. Offers text mining functionality that can be used to construct and visualize co-occurrence networks of important terms extracted from a body of scientific literature.
- CiteSpace: Java application for visualizing and analyzing trends and patterns in scientific literature.
- Official site.
- Documentation.
- Paper: "Analysis of citation networks as a new tool for scientific research" MRS Bulletin 2016. doi: 10.1557/mrs.2016.270
- Relationships among scientific paradigms. Well-publicized "map of science", generated using bespoke software. (Was reprinted in Nature, Discovery Magazine, SEED, etc.)
General Visualization Tools (that could be used for citation networks)
- Python: General-purpose high-level programming language.
- matplotlib for generalized plotting
- iPython network citation example
- NetworkX: Package for the creation, manipulation, and study of the structure, dynamics, and functions of complex networks.
- Snap.py: Python interface to SNAP, providing high-performance node/network layout and visualization.
- D3.js: JavaScript libraries for visualization. Well-suited to interactive web-based analytic tools.
- plotly: Data science collaboration platform.
- Cytoscape: Network analytics platform.
- gephi: Network graphs.
- Google Fusion Tables
Graphs
Social networks
Additional Information
- Potentially useful Google searches:
- visualization of citation networks
- visualization of citation networks (Image Search)
- network of scientific collaboration (Image Search)
- Python data visualization: Comparing 7 tools
- Top 30 Social Network Analysis and Visualization Tools
