Difference between revisions of "Extra:citation visualizations"
KevinYager (talk | contribs) (→Additional Information) |
KevinYager (talk | contribs) (→Existing tools for visualizing and data-analytics of citation networks) |
||
| Line 1: | Line 1: | ||
==Existing tools for visualizing and data-analytics of citation networks== | ==Existing tools for visualizing and data-analytics of citation networks== | ||
| − | * [ | + | * [http://www.vosviewer.com/ VOSviewer]: Tool for constructing and visualizing bibliometric networks. Offers text mining functionality that can be used to construct and visualize co-occurrence networks of important terms extracted from a body of scientific literature. |
* CiteSpace: Java application for visualizing and analyzing trends and patterns in scientific literature. | * CiteSpace: Java application for visualizing and analyzing trends and patterns in scientific literature. | ||
| Line 8: | Line 8: | ||
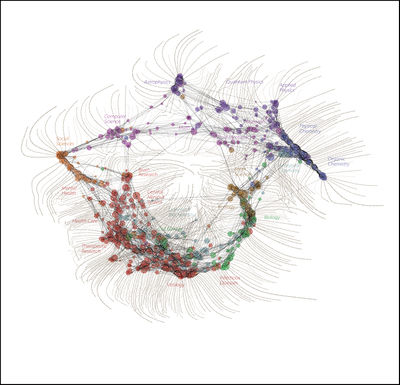
* [http://wbpaley.com/brad/mapOfScience/ Relationships among scientific paradigms]. Well-publicized "map of science", generated using bespoke software. (Was reprinted in Nature, Discovery Magazine, [http://seedmagazine.com/content/article/scientific_method_relationships_among_scientific_paradigms/ SEED], etc.) | * [http://wbpaley.com/brad/mapOfScience/ Relationships among scientific paradigms]. Well-publicized "map of science", generated using bespoke software. (Was reprinted in Nature, Discovery Magazine, [http://seedmagazine.com/content/article/scientific_method_relationships_among_scientific_paradigms/ SEED], etc.) | ||
[[Image:Scimaplarge.jpg|thumb|400px|center]] | [[Image:Scimaplarge.jpg|thumb|400px|center]] | ||
| − | |||
==General Visualization Tools (that could be used for citation networks)== | ==General Visualization Tools (that could be used for citation networks)== | ||
Revision as of 17:10, 16 November 2016
Existing tools for visualizing and data-analytics of citation networks
- VOSviewer: Tool for constructing and visualizing bibliometric networks. Offers text mining functionality that can be used to construct and visualize co-occurrence networks of important terms extracted from a body of scientific literature.
- CiteSpace: Java application for visualizing and analyzing trends and patterns in scientific literature.
- Relationships among scientific paradigms. Well-publicized "map of science", generated using bespoke software. (Was reprinted in Nature, Discovery Magazine, SEED, etc.)
General Visualization Tools (that could be used for citation networks)
- Python
- matplotlib for generalized plotting
- [iPython network citation example]
- NetworkX: Package for the creation, manipulation, and study of the structure, dynamics, and functions of complex networks.
Additional Information
- Potentially useful Google searches:
- visualization of citation networks
- visualization of citation networks (Image Search)
- network of scientific collaboration (Image Search)
- Top 30 Social Network Analysis and Visualization Tools
