Difference between revisions of "Example:Polymer clustering"
KevinYager (talk | contribs) |
KevinYager (talk | contribs) |
||
| Line 8: | Line 8: | ||
[[Image:Gel scattering example.png|thumb|center|300px]] | [[Image:Gel scattering example.png|thumb|center|300px]] | ||
| + | |||
| + | ==Kratky plot== | ||
| + | In a [[Kratky plot]] (<math>\scriptstyle q^2I(q) </math> vs. <math>\scriptstyle q</math>), the equation becomes: | ||
| + | |||
| + | :<math> | ||
| + | q^2 I(q) = \frac{A}{q^{n-2}} + \frac{C q^2}{1 + (q \xi)^m} + B q^2 | ||
| + | </math> | ||
| + | |||
==See Also== | ==See Also== | ||
Latest revision as of 11:25, 4 May 2016
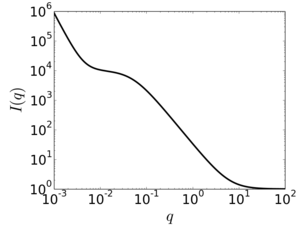
Polymer solutions frequently exhibit some degree of clustering of the polymer chains. A more extreme case are hydrogels, where the polymer chains may be strongly-associated, or even crosslinked, into a network or mesh.
Hammouda et al. proposed the following functional form to describe scattering intensity from such systems:
where B is a constant background. The first term represents the Porod scattering from clusters, while the second term is a Lorentzian function ascribed to the scattering of the polymer chains themselves. In the context of a gel, represents the average mesh size. The parameters A, C, n, and m may be used as fitting parameters.
Kratky plot
In a Kratky plot ( vs. ), the equation becomes:
See Also
- Diffuse scattering
- Boualem Hammouda, Derek L. Ho, and Steve Kline Insight into Clustering in Poly(ethylene oxide) Solutions Macromolecules 2004, 37 (18), 6932-6937. doi: 10.1021/ma049623d
- S.R. Kline "Reduction and Analysis of SANS and USANS Data using Igor Pro", J. Appl. Cryst. 2006, 39, 6, 895. doi:10.1107/S0021889806035059
- Takuro Matsunaga, Takamasa Sakai, Yuki Akagi, Ung-il Chung and Mitsuhiro Shibayama SANS and SLS Studies on Tetra-Arm PEG Gels in As-Prepared and Swollen States Macromolecules 2009, 42 (16), 6245–6252. doi: 10.1021/ma901013q
- R. A. Hule, R. P. Nagarkar, A. Altunbas, H. R. Ramay, M. C. Branco, J. P. Schneider and D. J. Pochan Correlations between structure, material properties and bioproperties in self-assembled β-hairpin peptide hydrogels Faraday Discuss. 2008, 139, 251–264. doi: 10.1039/B717616C
- R. A. Hule, R. P. Nagarkar, B. Hammouda, J. P. Schneider and D. J. Pochan Dependence of Self-Assembled Peptide Hydrogel Network Structure on Local Fibril Nanostructure Macromolecules 2009, 42, 7137–7145. doi: 10.1021/ma9003242
- B. Hammouda, F. Horkay and M. L. Becker Clustering and Solvation in Poly(acrylic acid) Polyelectrolyte Solutions Macromolecules 2005, 38, 2019–2021. doi: 10.1021/ma047960g
- Erika M. Saffer, Melissa A. Lackey, David M. Griffin, Suhasini Kishore, Gregory N. Tewb and Surita R. Bhatia SANS study of highly resilient poly(ethylene glycol) hydrogels Soft Matter 2014, 10,1905-1916. doi: 10.1039/C3SM52395K


