GI missing wedge
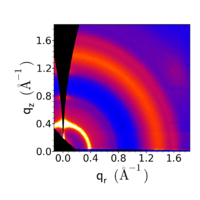
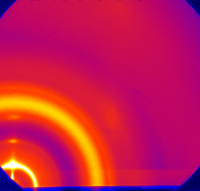
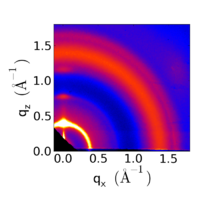
Grazing-incidence measurements give rise to a 'missing wedge' of data near the qz axis, owing to the curvature of the Ewald sphere.
 Data converted to q-space, taking into account the Ewald sphere. |
Explanation
Consider a sample coordinate system where z points vertical (film normal), y points along the beam, and thus x is orthogonal to both of those. The sample's reciprocal space is similar: qz is the film normal, qy is along the beam, and qx is across the sample (both qx and qy are in the sample plane). We can also define:
which is the total q-vector in the sample plane.
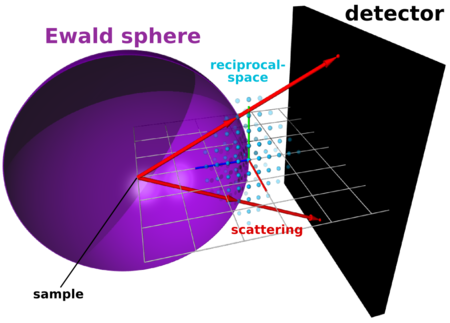
The detector is a flat plane, but in reciprocal-space, what the detector probes is a curved slice through the 3D reciprocal-space, known as the Ewald sphere. For small-angle scattering, it's a reasonable approximation to ignore this curvature and treat the detector image as a flat slice through reciprocal-space. But this becomes a poor approximation at wide-angles, where the curvature of the Ewald sphere is significant.
The curvature of the Ewald sphere means that any given pixel is not probing , but actually probing in the 3D space, where you can't assume (again, unless you're at sufficiently small angle). This leads to an inescapable ambiguity when trying to display this 3D slice on a 2D screen. The options are:
1. Just ignore the qy component, and plot qz on the vertical, and qx on the horizontal. This will look nice (no missing wedge). However it can be misleading. For instance, scattering rods that are vertical in reciprocal space will look curved in this view. (Higher orders along qz will not line up correctly.) Also, it looks like the image is showing the qz axis of reciprocal-space (where ), but this is a lie: in reality the experiment never probed the "true qz", since the Ewald sphere was curving away from this axis.
2. Alternatively, you can plot qz along the vertical, but plot qr along the horizontal. This introduces a 'missing wedge', which is physically correct in the sense that you never actually measured the qz axis in reciprocal space (the area where both and ). The downside is that you've essentially assumed that qx and qy are equivalent: i.e. that the film is an in-plane powder. For in-plane aligned samples, you may need to be careful about interpreting the image.
Either of the above options is acceptable for displaying data, as long as you're clear about what you're presenting, and remain mindful of the approximations introduced by the selected visualization.
qz axis
As described, the 'true' qz axis is not probed in a grazing-incidence experiment. This is often forgotten when GI images are shown without the 'missing wedge': in the raw detector image it looks like the qz axis is trivially recorded. It is possible to actually measure the qz axis: the most effective way is to perform a reflectivity experiment, where one measures the intensity of the specular beam as a function of incident angle. The reflectivity geometry (incident angle equals exit angle) rigorously maintains and .
A grazing-incidence experiment does, actually, intersect the true qz axis in two points: at the origin of reciprocal space (; i.e. the direct beam), and at the location of the specular reflection (which is usually behind the beamstop). One can thus reconstruct some portion of the qz axis simply by increasing the incident angle until the specular reflection is close to that point. Thus, to truly measure a peak spread near the qz axis, one needs to increase the incident angle to achieve a 'local specular' condition: i.e. to have the specular beam very close to the peak of interest, so that one is probing that peak near the qz axis.
See Also
- Quantification of Thin Film Crystallographic Orientation Using X-ray Diffraction with an Area Detector Jessy L. Baker, Leslie H. Jimison, Stefan Mannsfeld, Steven Volkman, Shong Yin, Vivek Subramanian, Alberto Salleo, A. Paul Alivisatos and Michael F. Toney Langmuir 2010, 26 (11), 9146-9151. doi: 10.1021/la904840q
- Simulating X-ray diffraction of textured films D. W. Breiby, O. Bunk, J. W. Andreasen, H. T. Lemke and M. M. Nielsen J. Appl. Cryst. 2008, 41, 262-271. doi: 10.1107/S0021889808001064


