The following describes how to think about integrated peak intensity (in reciprocal-space) in order to estimate the amount of material giving rise to the observed scattering peak.
General Form
The integrated intensity in reciprocal-space arising from a particular peak is proportional to the quantity (strictly, scattering volume) of the ordered structure that produces the scattering peak. In order to quantify the amount of an ordered population (e.g. a crystalline component), one must integrate over the entirety of reciprocal-space the intensity for the given peak.
In the most general case, let us denote the intensity of the peak in reciprocal space by the function  . The full intensity of the peak is then:

Of course the integration can be performed in whatever coordinate system is most convenient. For instance Cartesian coordinates:

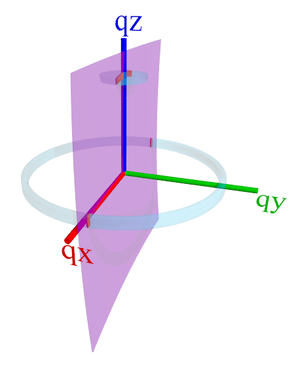
Or by converting to spherical coordinates  using:

It becomes:

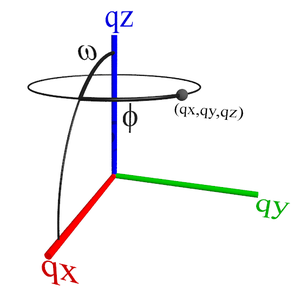
Coordinate system for spherical coordinates in reciprocal-space.
The peak of interest is localized near a particular q-value. This implies that spherical symmetry will be useful for integration. Let  be the peak center position, and let us decompose the distribution of the peak into a peak shape along the q-direction,
  , and an orientation distribution given by
  . We would then write:

In practice peaks are usually relatively sharp, so that we need only integrate within a small region,  near , in which case one can assume
  over the integration:

Powder Analysis
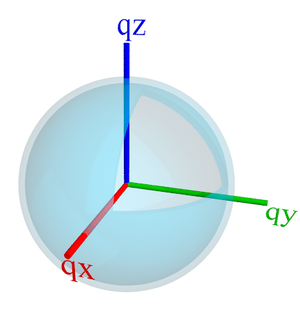
Scattering intensity in reciprocal-space for an isotropic powder. The cutout is only to help visualize that the scattering is a thin shell of uniform intensity.
Consider a measurement of an isotropic powder. In reciprocal-space, the scattering peak of interest is spread uniformly over a 'shell' at the position  . A measurement using a 2D detector, however, will only show a slice through this three-dimensional scattering space. A 2D slice of a 3D shell is a ring of uniform scattering intensity. In order to get the total integrated intensity for the peak, we can take advantage of the fact that the scattering is isotropic, such that:

Where c is a constant. (A normalized version of would have  .) In such a case:
![{\displaystyle {\begin{alignedat}{2}I_{\mathrm {total} }&=\int _{0}^{2\pi }\int _{0}^{\pi }\int _{q_{0}-\delta q}^{q_{0}+\delta q}I_{0}L(q)\Omega (\omega ,\phi )q^{2}\sin \omega \mathrm {d} q\mathrm {d} \omega \mathrm {d} \phi \\&=I_{0}\int _{q_{0}-\delta q}^{q_{0}+\delta q}L(q)q^{2}\mathrm {d} q\left[\int _{0}^{2\pi }\int _{0}^{\pi }c\sin \omega \mathrm {d} \omega \mathrm {d} \phi \right]\\&=I_{0}\int _{q_{0}-\delta q}^{q_{0}+\delta q}L(q)q^{2}\mathrm {d} q\left[c\int _{0}^{\pi }\sin \omega \mathrm {d} \omega \int _{0}^{2\pi }\mathrm {d} \phi \right]\\&=I_{0}\int _{q_{0}-\delta q}^{q_{0}+\delta q}L(q)q^{2}\mathrm {d} q\left[c\times 2\times 2\pi \right]\\&=I_{0}c4\pi \int _{q_{0}-\delta q}^{q_{0}+\delta q}L(q)q^{2}\mathrm {d} q\\&\approx I_{0}c4\pi q_{0}^{2}\int L(q)\mathrm {d} q\end{alignedat}}}](https://wikimedia.org/api/rest_v1/media/math/render/svg/02f56d7fd877db2ca2cd8ff12f1f6ed982089f59)
The spherical coordinate integration factors (in particular  ) disappear because the orientation distribution does not depend on angle (
 or
or  ). In other words, the relationship between the intensity measured on the detector and the integrated intensity is simply the surface area (in reciprocal space) of the spherical shell of scattering intensity (
 ).
).
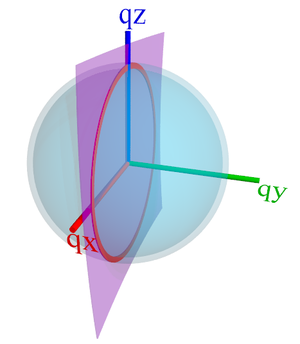
The intersection of the
Ewald sphere (purple sheet) with the scattering intensity (light-blue shell) produces a ring of uniform intensity (red ring) on the detector. Correct integration of this ring yields the intensity of the entire scattering shell, by taking advantage of the isotropic symmetry.
Thin Film with In-Plane Isotropy
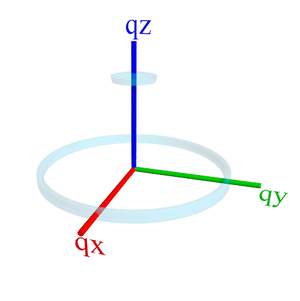
Example of the scattering intensity in reciprocal-space for a thin film that is 'in-plane isotropic'. In this example, there is some intensity from the scattering peak along the
qz axis (e.g. from horizontal crystal planes) and intensity in a ring around the
qx-
qy plane (e.g. from a population of vertical crystal planes with no in-plane preferential orientation).
In the general case the only way to determine the full integrated intensity is to scan the Ewald sphere and reconstruct the entire reciprocal space (e.g. by rotating the sample in-plane). However one can also take advantage of known symmetries of the sample. In the example above, for an isotropic powder, calculating the integrated intensity can be in fact be performed with a single line-scan along q.
For a thin film that is isotropic in-plane, a rotation about the film normal axis (changing angle ) would give the same detector pattern repeatedly. We can take advantage of this symmetry by aligning the spherical coordinate system with  pointed along the film normal direction. Thus instead of rotating the sample physically about , we can use the measured intensity distribution along a single -arc, and integrate along mathematically.
In other words, the in-plane isotropy guarantees that:

Such that:

Thus to obtain the integrated intensity (which is proportional to the amount of 'ordered' material) one can use a single measurement of the -arc (to get the distribution function  ) and integrate using the integration factor.
The intersection of the Ewald sphere (purple sheet) with the scattering intensity (light-blue volumes) produces scattering peaks (red) on the detector. Correct integration of these peaks yields the full intensity in reciprocal-space by taking advantage of the in-plane isotropic symmetry. The scattering peak observed along the
qz axis represents a smaller population of grains than the scattering peak appearing along the
qx axis.
Effect of Resolution Function
The resolution of a given measurement has a dramatic effect on the peak shapes seen on the detector. Peak broadening also occurs in directions normal to the detector surface, such that some intensity falls outside the slice that the detector captures. In order to quantitatively compare the intensity measured on a detector with either theory or another intensity measurement, one must account for these resolution effects.
Note, however, that the effect of the resolution function is to 'smear' the intensity in reciprocal-space. Conceptually, each point in reciprocal-space has its intensity spread out over a certain region (e.g. an ellipsoid). However the total scattering intensity is unchanged. In this sense, performing an integration is inherently insensitive to any resolution effects, so long as the integration is large enough to fully capture the broadened peak. The 'broadening' includes both the local spread of a peak due to resolution effects, as well as the distribution of the scattering intensity over a shell in reciprocal space due to the orientation distribution of the grains in the material.
Thus, when comparing sub-sections of scattered intensity, the resolution correction must be included. But when comparing the total integrated intensity, any such correction would disappear because by definition we are integrating all the intensity arising from a particular scattering peak.


