Example:P3HT orientation analysis
This tutorial describes how to quantify the orientation distribution of the semiconducting polymer P3HT. This orientation analysis is meant to determine the relative amounts of the material oriented in different ways. The same kind of analysis can be applied to other semiconducting polymers or small-molecules. In fact, the same conceptual steps can be applied more broadly to determining any kind of orientation distribution (though one must be careful in interpreting the relationship between reciprocal-space peaks, which will be different for each material's specific unit cell).
P3HT orientation
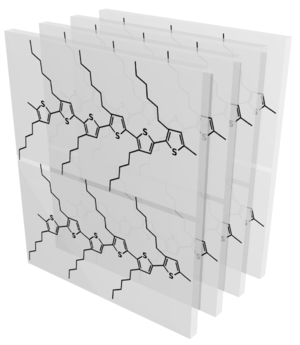
P3HT crystallizes into the unit cell shown below. P3HT crystals are anisotropic, often appearing as long needle-like structures. Note that this unit cell is highly idealized: the alkyl side-chains have considerable freedom and thus disorder (they may even be liquid-like). Moreover, real samples of P3HT organize in a more disordered state than shown here. Although the lamellar stacking is well-defined, and the aromatic (π-π) stacking is also well-defined, one typically does not observe any scattering peak along the backbone direction: i.e. there is usually no well-defined persistence of order in this direction. It is also likely that subsequent chains do not organize with the well-defined registry shown in the cartoon. Overall, P3HT is thus better thought of as being semi-crystalline or liquid-crystalline: it exhibits considerable molecular order (giving rise to scattering peaks), but is not an extended well-ordered crystal.

When P3HT is cast as a thin-film, this unit cell can adopt a variety of orientations. Although most materials form 3D powders when cast from solution, P3HT adopts a relatively well-defined orienation with respect to the substrate. It seems that the alkyl side-chains preferentially segregate to the film-air and film-substrate interfaces (presumably in order to lower the interfacial energy), which drives the material overall into the edge-on orienation shown below:
Absent any other driving force, the above configurations are assumed to be in-plane isotropic (2D powders). In such a case, one would expect to see reciprocal-spaces corresponding to these states of:
Analysis: In-plane powder
TBD
Caveats
- Standing-up: The preceeding analysis has assumed that the 100 scattering along qr arises from face-on material. However, both face-on and end-on material would give rise to scattering at that position in reciprocal-space. To differentiate between those two possibilities, one must invoke additional data. Specifically, one can look at the 010 (π-π) peak: for end-on, the π-π peak will also be in-plane (along qr), whereas for face-on, one should observe substantial intensity of the π-π peak in the out-of-plane direction (near qz axis).
Analysis: In-plane aligned
TBD
See also grating alignment for caveats related to the in-plane angle (ϕ).
Literature
Development/description of analysis method
- Nanoimprint-Induced Molecular Orientation in Semiconducting Polymer Nanostructures Htay Hlaing, Xinhui Lu, Tommy Hofmann, Kevin G. Yager, Charles T. Black, and Benjamin M. Ocko ACS Nano 2011, 5 (9), 7532-7538 doi: 10.1021/nn202515z
- Enhanced charge collection in confined bulk heterojunction organic solar cells Jonathan E. Allen, Kevin G. Yager, Htay Hlaing, Chang-Yong Nam, Benjamin M. Ocko and Charles T. Black Applied Physics Letters 2011, 99, 163301. doi: 10.1063/1.3651509 c.f. Supplementary Information
- One-Volt Operation of High-Current Vertical Channel Polymer Semiconductor Field-Effect Transistors Johnston, D.E.; Yager, K.G.; Nam, C.-Y.; Ocko, B.M.; Black, C.T. Nano Letters 2012, 8, 4181–4186 doi: 10.1021/nl301759j
- Nanostructured Surfaces Frustrate Polymer Semiconductor Molecular Orientation Johnston, D.E.; Yager, K.G.; Hlaing, H.; Lu, X.; Ocko, B.M.; Black, C.T. ACS Nano 2014 doi: 10.1021/nn4060539
Application of method
- Stable and Controllable Polymer/Fullerene Composite Nanofibers through Cooperative Noncovalent Interactions for Organic Photovoltaics Fei Li, Kevin G. Yager, Noel M. Dawson, Ying-Bing Jiang, Kevin J. Malloy, and Yang Qin Chemistry of Materials 2014 doi: 10.1021/cm501251n
Related papers
Angular correction (curvature of Ewald sphere)
- Quantification of Thin Film Crystallographic Orientation Using X-ray Diffraction with an Area Detector Jessy L. Baker, Leslie H. Jimison, Stefan Mannsfeld, Steven Volkman, Shong Yin, Vivek Subramanian, Alberto Salleo, A. Paul Alivisatos and Michael F. Toney Langmuir 2010, 26 (11), 9146-9151. doi: 10.1021/la904840q
- Simulating X-ray diffraction of textured films D. W. Breiby, O. Bunk, J. W. Andreasen, H. T. Lemke and M. M. Nielsen J. Appl. Cryst. 2008, 41, 262-271. doi: 10.1107/S0021889808001064
sin(angle) correction
- Confinement-Driven Increase in Ionomer Thin-Film Modulus Kirt A. Page, Ahmet Kusoglu, Christopher M. Stafford, Sangcheol Kim, R. Joseph Kline, and Adam Z. Weber Nano Letters 2014, 14 (5), 2299-2304. doi: 10.1021/nl501233g
Other orientation analyses
- Evaluation of equatorial orientation distributions C. Burger and W. Ruland J. Appl. Cryst. 2006, 39, 889-891. doi: 10.1107/S0021889806038957
- Two-dimensional small-angle X-ray scattering of self-assembled nanocomposite films with oriented arrays of spheres: determination of lattice type, preferred orientation, deformation and imperfection W. Ruland and B. M. Smarsly J. Appl. Cryst. 2007, 40, 409-417. doi: 10.1107/S0021889807010503
- Device-Scale Perpendicular Alignment of Colloidal Nanorods Jessy L. Baker, Asaph Widmer-Cooper, Michael F. Toney, Phillip L. Geissler and A. Paul Alivisatos Nano Letters 2010, 10 (1), 195-201. doi: 10.1021/nl903187v