Reciprocal-space
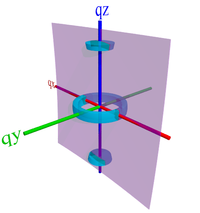
Reciprocal-space is a conceptual three-dimensional space which contains the full 3D scattering pattern of a given sample. It is the 3D Fourier transform of the sample's realspace electron-density distribution. It may also be called inverse-space, q-space, or Fourier space.
The distribution of intensity in reciprocal-space can be arbitrarily complex. For a sample with a distinct and non-trivial internal structure, the Fourier transform will be highly complex and difficult to interpret. However, samples of scientific interest generally have certain regularities, which give rise to a reciprocal-space with recognizable features, making the data easier to understand and analyze. In particular, a well-defined repeating structure in realspace gives rise to a sharp peak in reciprocal-space. The position of the peak encodes the repeat-spacing (the peak width encodes the correlation length, etc.).
Detector Image
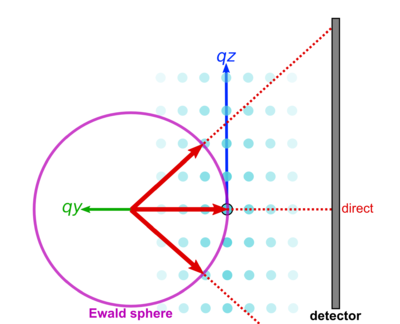
The concept of reciprocal-space is extremely useful, because it allows one to connect between experiment geometry and the scattering equations. In particular, the scattering observed on a 2D detector plane during an experiment is actually a particular 'slice' through the 3D reciprocal-space. Thus, one can probe different regions of reciprocal-space by reorienting the sample with respect to the beam.
The 'slice' through reciprocal-space is not strictly a plane: it is actually the surface of a sphere, known as the Ewald sphere.
Conversion to q-space
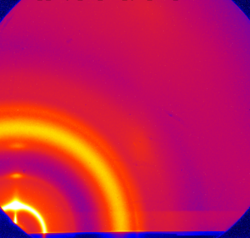
The raw detector image needs to be converted into reciprocal-space. This is typically done by using a calibration standard, which has rings at known q-position. The purpose of calibration is to convert from pixel position to value. One needs to know:
- The x-ray wavelength. This is known since it is set by the x-ray source (and/or monochromator).
- The unitless detector distance D/d, where D is the detector distance and d is the detector width. Since d is typically known, one can either measure D directly (even using a tape measure is reasonably accurate), or by noting the pixel position of a ring in calibration standard.
- Direct beam position (i.e. the pixel position of the direct beam). Even with the beam blocked by a beamstop, low-q beam spillover is usually sufficient to note the beam position. One can also determine the center of scattering rings to define the beam position.
- Detector tilt. This can be assessed by noting the curvature of scattering rings from a standard sample.
With the above information, one can convert from the raw image into data in reciprocal-space (various pieces of software will do this for you).
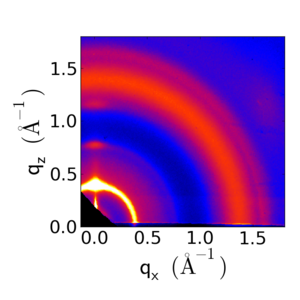
Notice that one can either display the data as or as , where:
The representation ignores the qy component of the momentum transfer. For small-angle measurements (GISAXS), this is a reasonable approximation. However for wide-angle (GIWAXS) measurements, this is a poor approximation: the curvature of the Ewald sphere means that the part of reciprocal-space probed by the detector is curving away from the plane. As such, in the representation, we note a 'missing wedge' of data near the qz axis. In fact, in grazing-incidence geometry, we do not probe the true qz axis, except at two points (the direct beam position, and the specularly-reflected beam position).
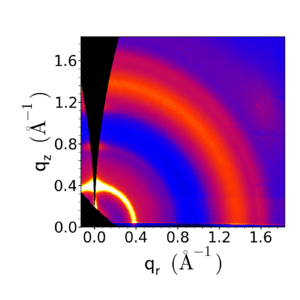 Data converted to q-space, taking into account the Ewald sphere. |
The conversion to q-space is necessary for all subsequent analysis steps. Moreover, we typically are interested in χ defined in reciprocal-space (i.e. with respect to the sample coordinates, not the instrument reference frame), so we should compute χ in the representation shown above.
Caveats
Although it is extremely useful to imagine that the detector image is a slice through reciprocal-space, one must keep in mind other effects can influence what one observes on the detector. For instance, anything which affects the scattered beams as they travel to the detector will influence the image one sees. For example, ambient air will scatter the beam, giving rise to a background signal (which will look like diffuse scattering). As another example, portions of the instrument (e.g. sample windows) can attenuate or obstruct the x-ray beam.
The sample itself can also affect the scattered rays, again making the detector image not strictly a map of reciprocal-space. The scattering may be attenuated as it transits through the sample; this attenuation may be non-uniform. In GISAXS, the observed image is distorted due to refraction of both the incident beam and the scattered rays. This refraction distortion is non-trivial. Dynamic scattering also gives rise to multiple scattering peaks (some due to the direct beam, and some due to the reflected beam), as well as more complex effects such as the Yoneda streak and waveguide streaks.
Thus, especially in GISAXS, one must be careful about naively interpreting the detector image as being a direct replica of reciprocal-space. On the other hand, all of the complications noted above can be accounted for; thus GISAXS data can be quantitatively mapped into the 'true' reciprocal-space.
Accessible Regions
TBD
